Some useful functions
Sun Jul 13 2025
Articles in the On Grids series
- Let's go deeper
- Iterating on a theme
- Some useful functions
- On Grids
- Turtles all the way down
Before we move onto some more fun stuff, it makes sense to spend some time creating some useful utility functions. These functions will be used over and over again through your grid creation experiments and are really useful.
If you just want to see all the utility functions in one place, click here. It can be useful to add some console logs to see what comes out of them.
Lerp
A pretty standard lerp function. This function returns a number between a and b at the point represented by t.
lerp = (a, b, t) => a + (b - a) * t;For example:
lerp(100, 200, .5) // 150Other people have explained lerp far better than I ever could. For a really in-depth look at, take a look at SimonDev's great YouTube video.
Grid positions
When you're programming grids, it often makes sense to store them 1-dimensionally, that is: in an array. This makes things relatively simple and safe from a developmental perspective, but can cause challenges in trying to think about them. This being the case, you can create a couple of functions that make conversion to and from the array index (ID) trivial.
I explained these a bit in my previous post, see here.
But we can take this further. If we think through our grid, each cell is made up of 4 points and 4 edges, so given the cell ID, it would be super convenient to be able to find, those. Too.
function getPointsForGridId(id, w) {
  const { x: col, y: row } = getGridPosition(id, w);
  return [
    { x: col, y: row }, // top left
    { x: col + 1, y: row }, // top right
    { x: col + 1, y: row + 1 }, // bottom right
    { x: col, y: row + 1 }, // bottom left
  ];
}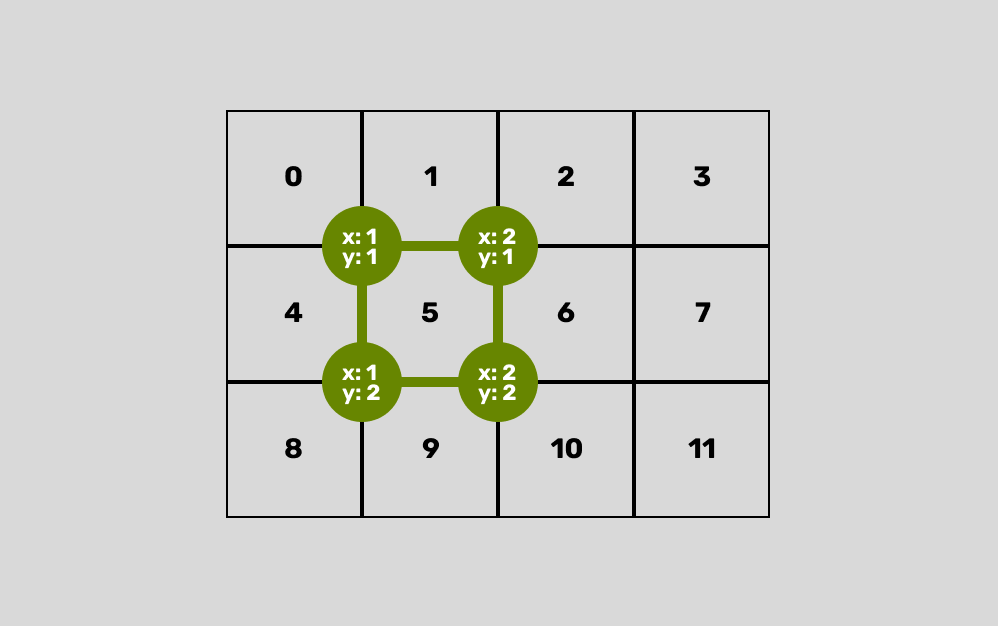
This function takes the cell ID (id) and the grid width (w) and returns an array containing the points that make the cell up in a clockwise direction from the top-left.
Edge IDs
Similarly, it can be very useful to be able to derive the IDs of edges from the grid cell to which they belong. This way you can create deterministic functionality based on the edge, without having to store a state for the edge.
Remember, these functions expect grid-specific units. So width and height in the number of cells in each direction, and points and positions in grid-relative coordinates ([1,1], [2, 1], [3, 1] etc).
getHorizontalEdgeId = (x, y, w) => x * w + y;This function returns a unique ID for a horizontal edge. It's defined by the x position of its left endpoint and the y position of both its endpoints (the y position will be the same for both points). The w parameter expects the width of the grid, which helps calculate a unique ID for each horizontal edge based on its position within the grid.
getVerticalEdgeId = (x, y, w, h) =>
  w * h + w + (x * h + y);
Similarly, this function returns the unique ID of a vertical edge.
It takes the x position of both its endpoints and the y position of its top endpoint. The w and h parameters represent the width and height of the grid, respectively.
We add w * h + w to the calculated vertical edge position to ensure its ID is distinct from any possible horizontal edge IDs. This design effectively creates a continuous sequence of edge IDs, where all horizontal edge IDs come first, followed by all vertical edge IDs, as if they were laid out in a single array.
export function getEdgeIDBetweenPoints(a, b, w, h) {
  // Check for horizontal adjacency
  if (a.y === b.y && Math.abs(a.x - b.x) === 1) {
    const canonicalX = Math.min(a.x, b.x);
    return getHorizontalEdgeId(canonicalX, a.y, w);
  }
  // Check for vertical adjacency
  if (a.x === b.x && Math.abs(a.y - b.y) === 1) {
    const canonicalY = Math.min(a.y, b.y);
    return getVerticalEdgeId(a.x, canonicalY, w, h);
  }

  console.warn("No edge between these points");
  return null;
}
This function is a helper that figures out if two given points, a and b, are connected by an edge in the grid. If they are, it then calls the correct function (getHorizontalEdgeId or getVerticalEdgeId) to get that edge's unique ID.
It first checks if the points are horizontally adjacent (same y, x coordinates one unit apart). If so, it uses the smaller x value to get the horizontal edge ID.
If not horizontal, it then checks for vertical adjacency and gets the vertical edge ID.
Joining the dots
Joining the concepts of points and edges together is relatively straightforward at this point, we have all of the pieces we need to retrieve the 4 grid IDs, given a cell ID.
function getEdgeIdsForGridId(id, w, h) {
  const points = getPointsForGridId(id, w, h);
  return [
    getEdgeIDBetweenPoints(
      points[0],
      points[1],
      w, h), // top edge
    getEdgeIDBetweenPoints(
      points[1],
      points[2],
      w, h), // right edge
    getEdgeIDBetweenPoints(
      points[2],
      points[3],
      w, h), // bottom edge
    getEdgeIDBetweenPoints(
      points[3],
      points[0],
      w, h), // left edge
  ];
}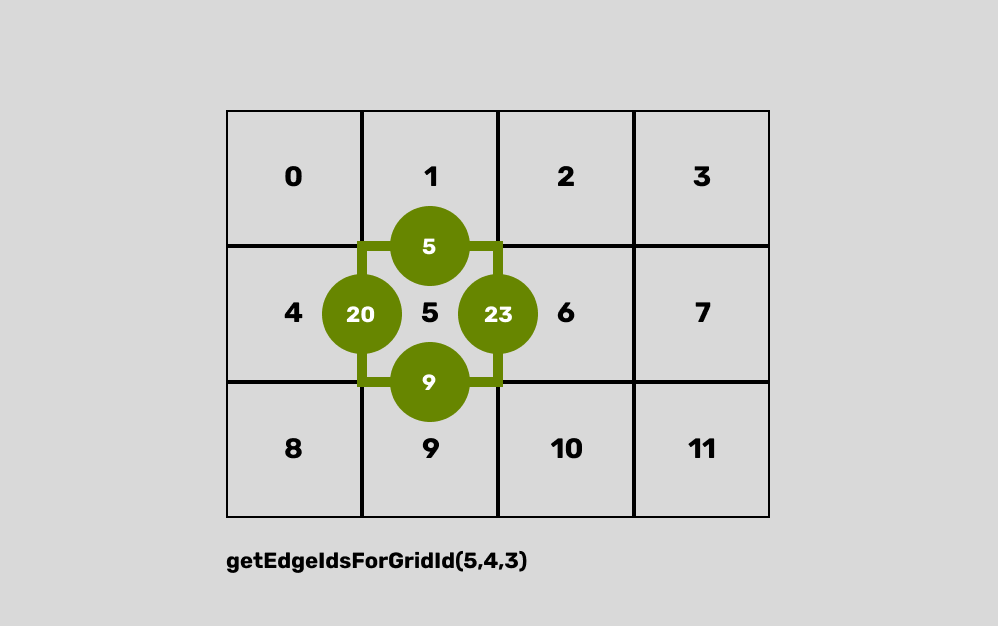
This function takes the cell ID and the grid width and height (h) and returns an array of the IDs of the edges that make up the cell.
Take a look at this codepen link to see a demonstration of all of these functions in action.
Making something of all this
Alright, so what can we do with all this? Let's use the information we can derive about grids, using these functions, to draw a random-seeming, but functional generative system.
Boilerplating
We'll need some basic configuration, and probably a control panel so we can play around with our config.
import { Turtleman } from "https://esm.sh/turtleman@1.0.7";
import { Pane } from "https://cdn.jsdelivr.net/npm/tweakpane@4.0.5/dist/tweakpane.min.js";
import {
  lerp,
  getPointsForGridId,
  getEdgeIdsForGridId,
} from "https://codepen.io/shubniggurath/pen/OPyPdmm.js";

const CONFIG = {
  width: 800,
  height: 800,
  gridW: 20,
  gridH: 20,
};
// --- PANE ---
const pane = new Pane();
const f1 = pane.addFolder({
  title: "Config",

});
f1.addBinding(CONFIG, "width");
f1.addBinding(CONFIG, "height");
f1.addBinding(CONFIG, "gridW", {
  step: 1,
  min: 1,
  max: 100,
});
f1.addBinding(CONFIG, "gridH", {
  step: 1,
  min: 1,
  max: 100,
});
f1.on("change", (ev) => {
  rebuild();
});


// --- MAIN ---
let toy;
const rebuild = () => {
  if (toy) toy.element.remove();

  const { width, height, gridW, gridH } = CONFIG;
  const cellWidth = width / gridW;
  const cellHeight = height / gridH;

  toy = new Turtleman({
    width,
    height,
    strokeWidth: 2,
    angleType: "radians",
  });
  container.appendChild(toy.element);
}
rebuild()
This just sets up the imports, the basic configuration (canvas dimensions and grid dimensions) and the control panel that'll allow you to play with these in real time. It also sets a rebuild function which is where most of our work will take place.
Create our state objects
These objects will hold critical information about the grid.
  const cells = [...Array(gridW * gridH)].map((_, i) => {
    return {
      points: getPointsForGridId(i, gridW),
      edges: getEdgeIdsForGridId(i, gridW, gridH),
      direction: Math.random() > 0.5 ? 1 : -1,
    };
  });
Cells is an array of objects that define each cell's properties, including the points that make it up, the edge IDs, and the direction, which we'll use to change the way the cell behaves. Notice direction has an equal chance of being either 1 or -1.
Draw in the cell
For each cell, we want to draw a line on the halfway point of each edge to an adjacent edge.
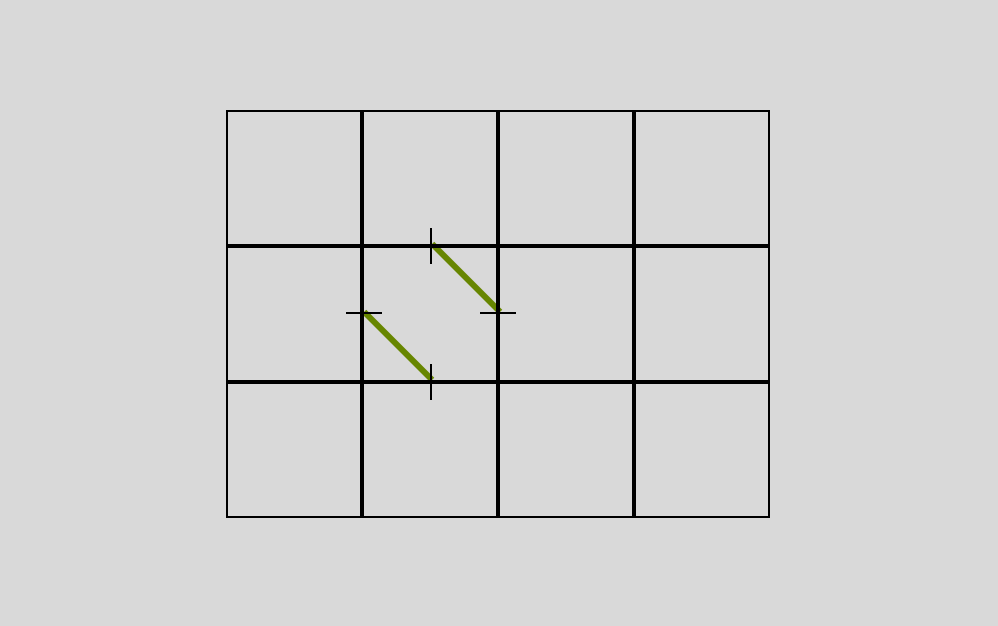
Picking which adjacent edge - the left or right - is based on that direction variable we defined earlier. And so you can imagine, but repeating this process, we can get very simple rule-based generation that ends up looking quite complex.
Alright, let's create our basic loop and then iterate from there.
  cells.forEach((cell) => {
    const edgeDirection = cell.direction;

    const topEdgePoint = {
      x: lerp(cell.points[0].x, cell.points[1].x, 0.5),
      y: cell.points[0].y,
    };
    const bottomEdgePoint = {
      x: lerp(cell.points[3].x, cell.points[2].x, 0.5),
      y: cell.points[2].y,
    };
    const leftEdgePoint = {
      x: cell.points[0].x,
      y: lerp(cell.points[0].y, cell.points[3].y, 0.5),
    };
    const rightEdgePoint = {
      x: cell.points[1].x,
      y: lerp(cell.points[1].y, cell.points[2].y, 0.5),
    };

    let a,b,c,d;
    if (edgeDirection === 1) {
      a = topEdgePoint;
      b = rightEdgePoint;
      c = bottomEdgePoint;
      d = leftEdgePoint;
    } else {
      a = topEdgePoint;
      b = leftEdgePoint;
      c = bottomEdgePoint;
      d = rightEdgePoint;
    }

    toy.jump(a.x * cellWidth, a.y * cellHeight);
    toy.goto(b.x * cellWidth, b.y * cellHeight);
    toy.jump(c.x * cellWidth, c.y * cellHeight);
    toy.goto(d.x * cellWidth, d.y * cellHeight);
  });
This loops through the cell array we created earlier, creates points at the halfway point of each edge and then assembles the points to connect, and draws them. There are a couple of smaller pieces of code in here that it makes sense to take a closer look at.
    const topEdgePoint = {
      x: lerp(cell.points[0].x, cell.points[1].x, 0.5),
      y: cell.points[0].y,
    };
This is the code used for finding the point half way along the top edge. You can see we take the interpolation of the top-left point's x position and the top-right point's x position using an interpolant of 0.5 (for half way). This is then repeated for each side.
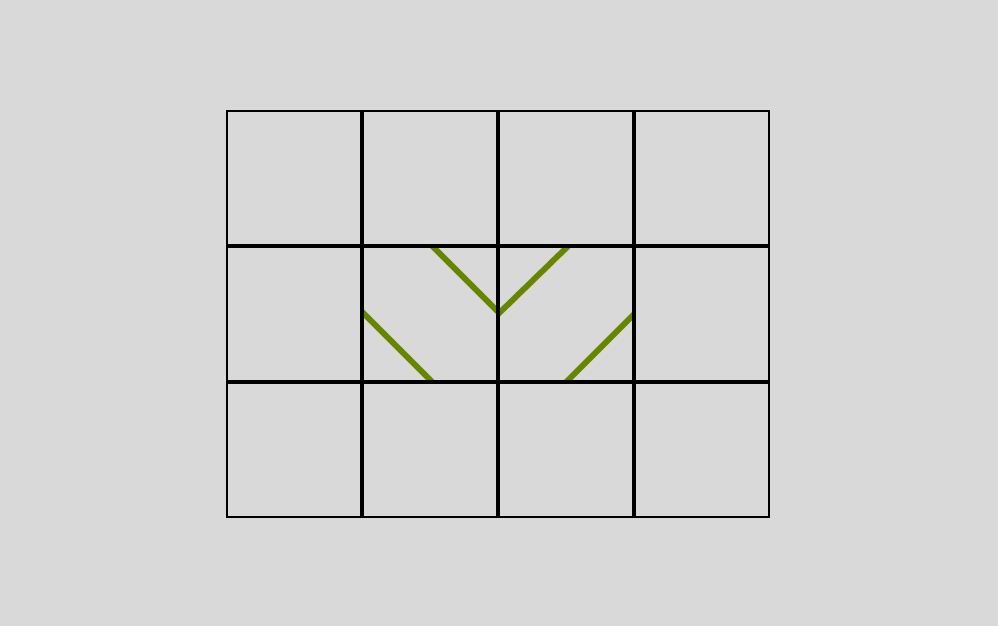
    let a,b,c,d;
    if (edgeDirection === 1) {
This code just assembled the 4 points to use for drawing. Two lines are drawn for each cell: a->b and c->d. We just swap b and d depending on the cell's direction.
You can see this code in action over on codepen. What other sorts of patterns can you make with this system?